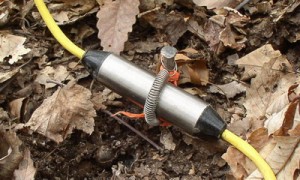
Electrical resistivity (ER) survey is a geophysical technique that produces an image of the subsurface showing the distribution of electrical conductivity, down to depths of several hundred feet. Fundamentally, dry rock has many orders of magnitude greater resistivity (lower conductivity) than rock that contains water. Virginia Groundwater LLC has conducted more than 100 of these surveys prior to drilling wells in central Virginia. This technology has proven very reliable for mapping water-bearing fractures underground. In simple terms, this type of survey involves driving a series of 24-inch stainless steel stakes into the ground.
A survey using 56 stakes at 18-foot intervals will span almost 1000 feet at the surface, and generate an image that extends downward to between 250 and 300 feet. A series of electrical switches are then attached to the stakes and wired to the field recording device.

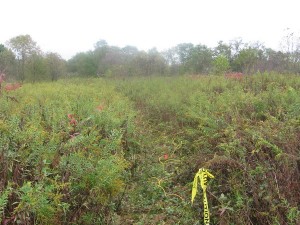
Geophysical survey lines are blazed through the jungle (as necessary), electrode positions surveyed and marked so that the resulting image can be located and oriented in the field after the data have been processed.
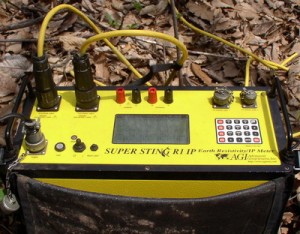
CSG Geotechnical Services uses a SuperSting R1IP Earth Resistivity meter manufactured by Advanced Geosciences, Inc. of Austin, Texas.

The "box" contains electrical hardware to generate voltage that is input to the ground through "sending" pairs of electrodes, and record voltages between "receiving" pairs.
Voltage is applied sequentially to pairs of electrodes, while the voltage received by other pairs is measured and recorded. When all possible combinations of pairs of electrodes have been tested, the field data are taken back to the office and processed by computer. Voltages are converted to values of resistance using Ohms Law, and a best-fit model of the survey profile is constructed by iterative processes. The image below is a resistivity profile from southern Albemarle County, in granite bedrock terrain.
Areas in blue represent areas of low resistivity value. These correlate with water-bearing fractures in the subsurface. In this particular case, the drilling produced a well with a yield of 60 gallons per minute. Please visit our gallery of resistivity profiles surveyed on some of the major geologic formations in central Virginia.

 (434) 466-1280

